Monitoring Jobs and Nodes
After submitting a job, it is important to monitor the cluster utilization,
that is, the processor, memory, network and storage usage of the job.
For this purpose, the users are allowed to login on the compute nodes
they allocate.
To see which nodes are used by a job, one can use the Slurm command squeue.
After logging-in on a particular node, the processes can be
monitored using the usual commands top, htop and atop.
A better way to monitor and explore the cluster status is to use the web application at it.fysik.su.se/hpc-moni. This site contains tools which enable users to interactively view the Slurm queues and jobs, the compute node status, and the overall cluster health.
HPC-moni Application
The HPC monitoring application is located at https://it.fysik.su.se/hpc-moni.
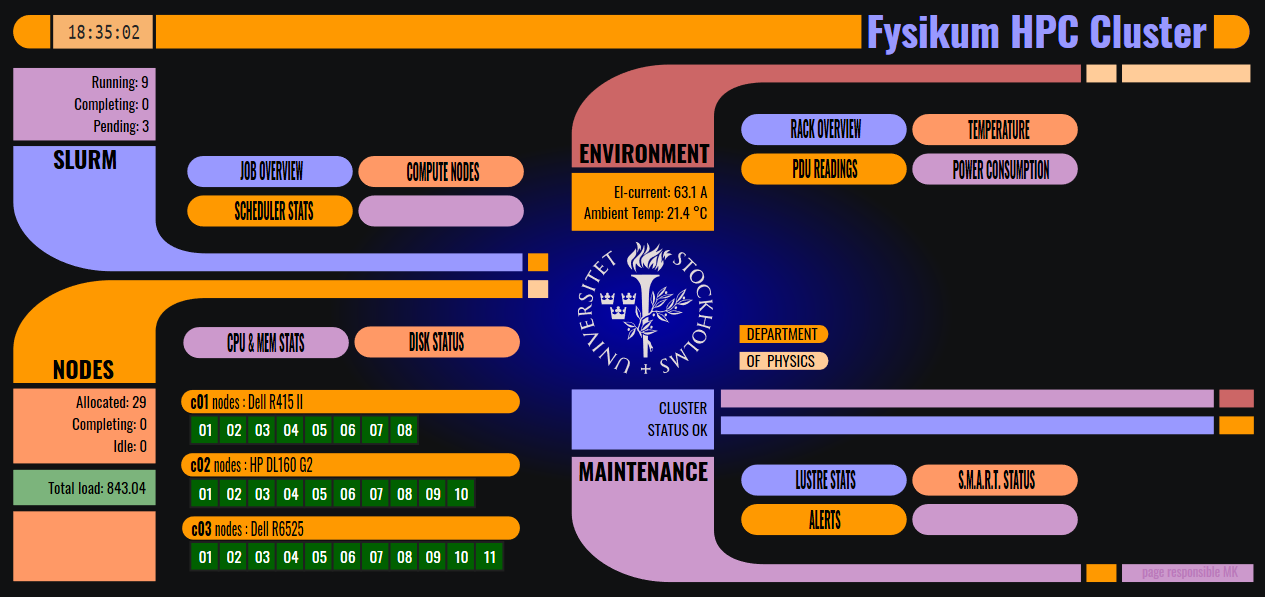
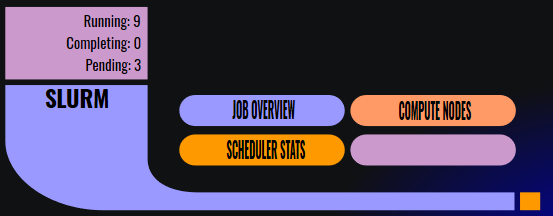
The initial screen (homepage) shows a general information about the cluster, like the queue and node status, or the ambient temperature and the current power consumption.
The home page also serves as the main menu, with links to other pages displaying a more detailed metrics. The cluster metrics are obtained using Prometheus exporeters and shown in different panels using Grafana. The panels are organized into four groups:
SLURM
Job overview (Slurm
squeue)Compute nodes status (Slurm
sinfo)Slurm scheduler statistics
NODES
CPU and memory statistics of node groups
Disk status (per node)
Node details (grouped by different hardware characteristics)
ENVIRONMENT
Rack overview
Power distribution units (PDUs) current readings
Power consumption details
Temperature (ambient, CPU and disk)
MAINTENANCE
Lustre file system statistics
S.M.A.R.T. disk status (available to admins only)
Alerts (available to admins only)
Slurm jobs
The Slurm queue status can be obtained selecting one of the following links:
Jobs overview
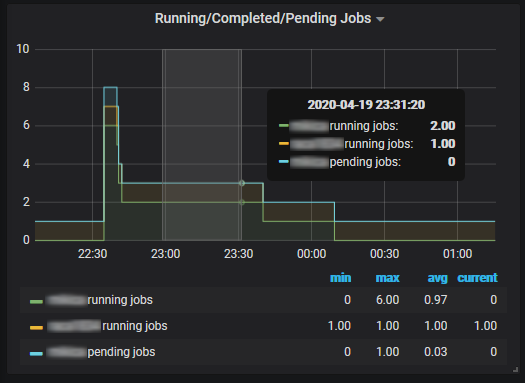
The Slurm job overview page shows information about the running/completed/pending jobs and the allocated/completing/idle nodes. It also shows the running and pending jobs over time and the table with the current running and pending jobs.
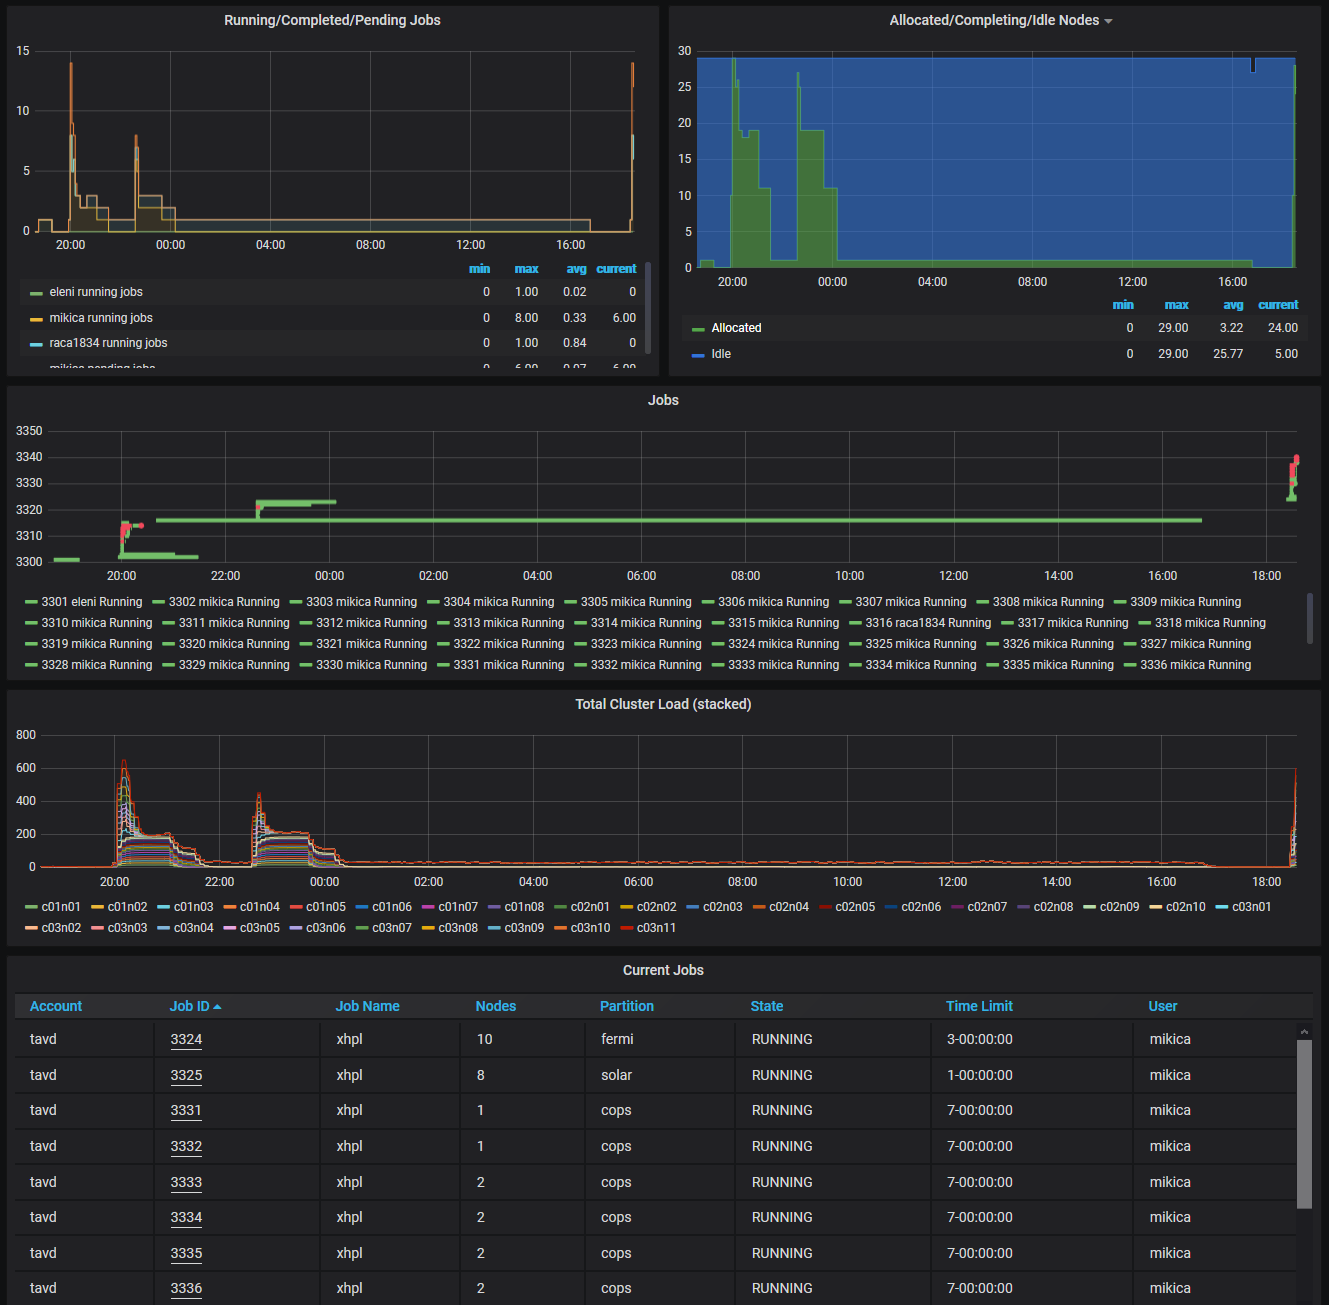
To take a closer look at some jobs, one can zoom-in the specific time interval.
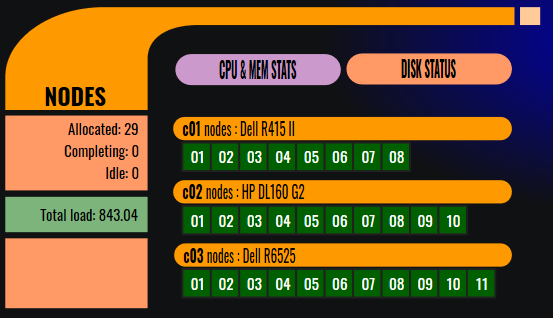
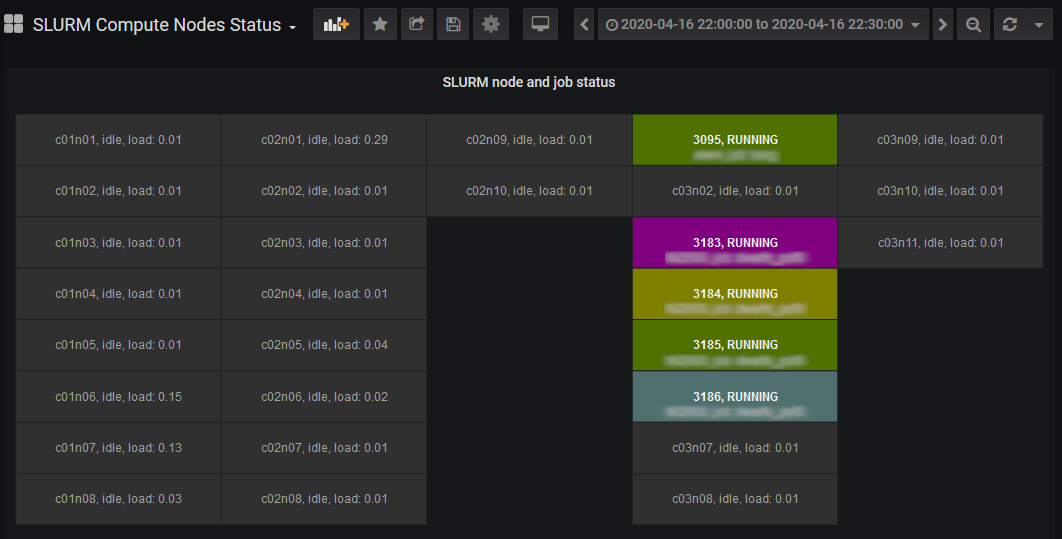
Compute nodes
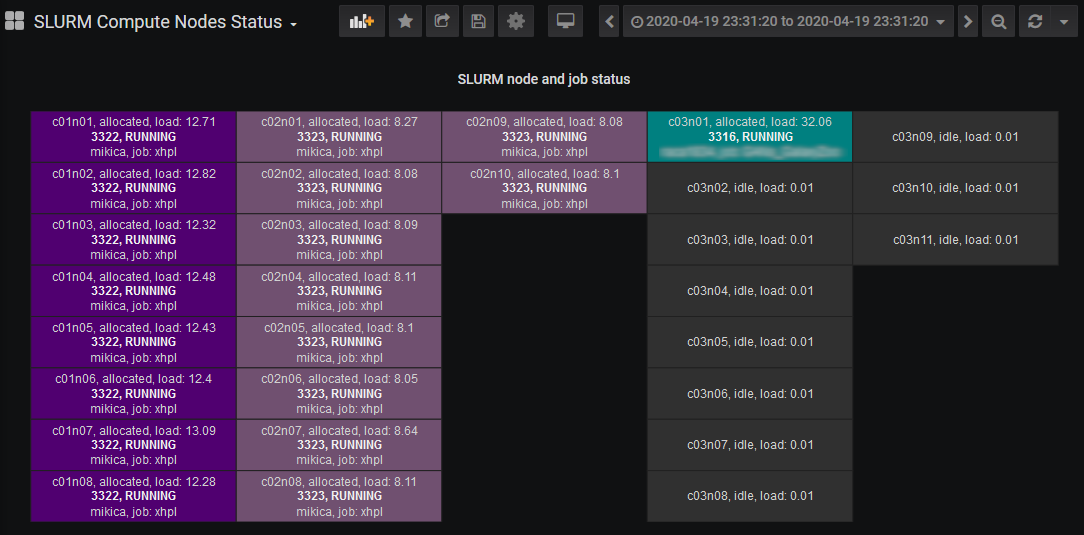
This page shows the current compute node status. Nodes belonging to differnt jobs are highlighted in different colors. Clicking on a node leads to the Node Details page, which shows the cpu and memory usage of the node.
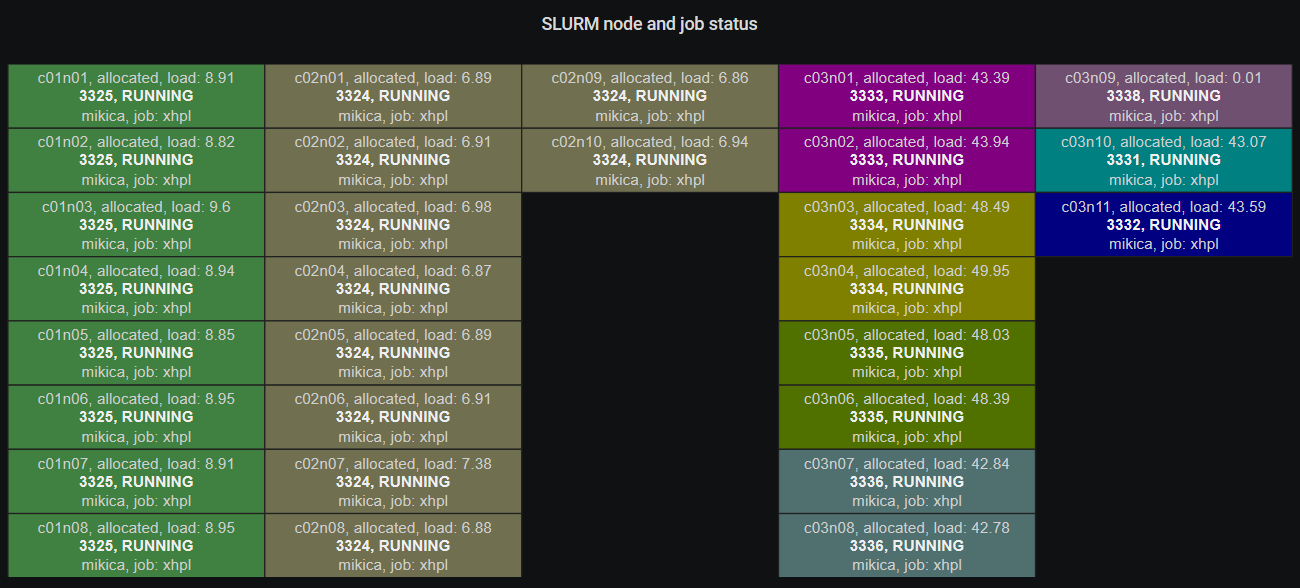
Note
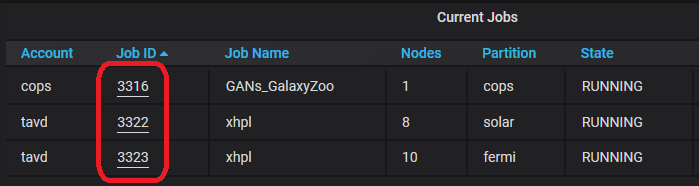
Clicking on a job listed in the Current Jobs table found at the Jobs Overview page shows the Compute Nodes page with the allocations at the specific time.
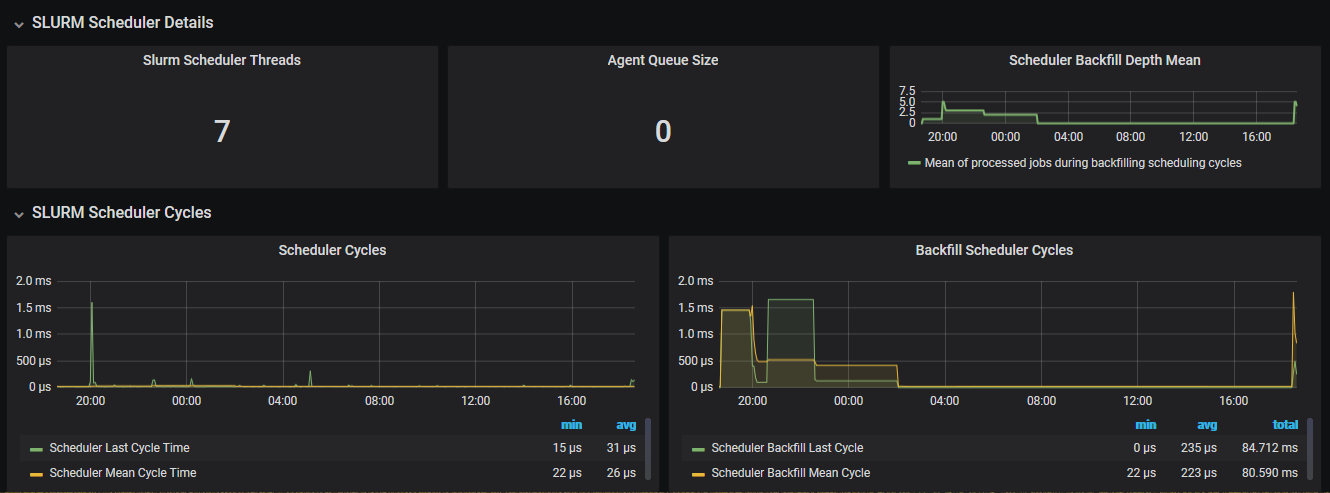
Scheduler statistics
The scheduler statistics page shows additional Slurm information, like the number of failed jobs and nodes.
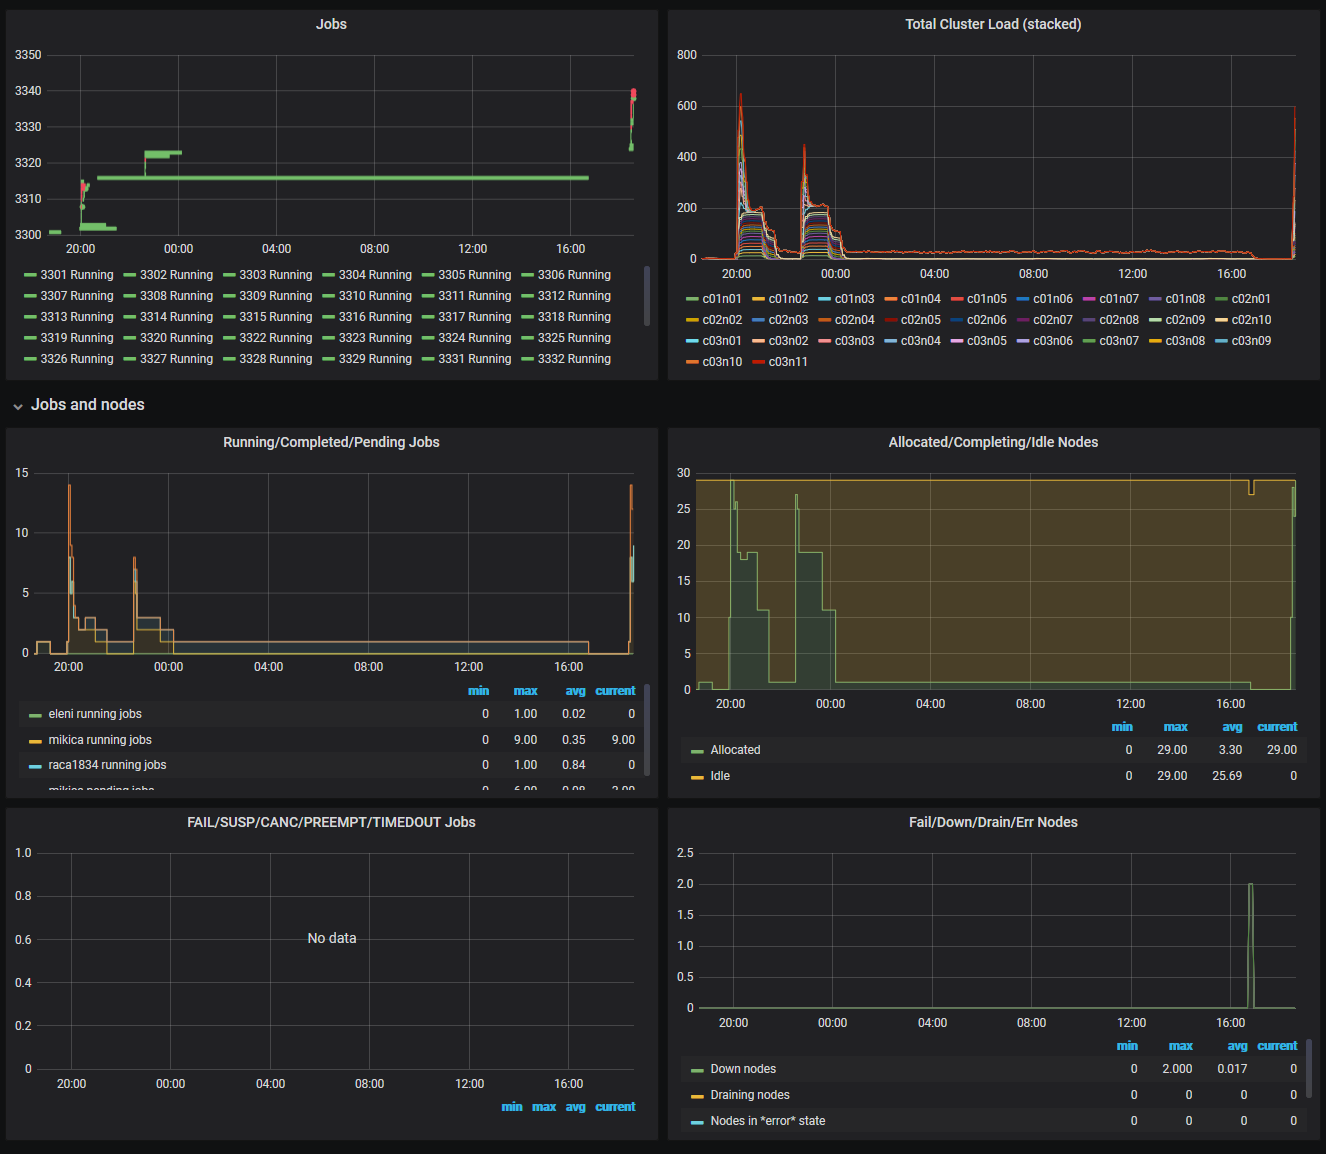
At the end, this page shows the scheduler metrics: the number of scheduler threads and the backfill depth together with the scheduler and backfill scheduler cycles.
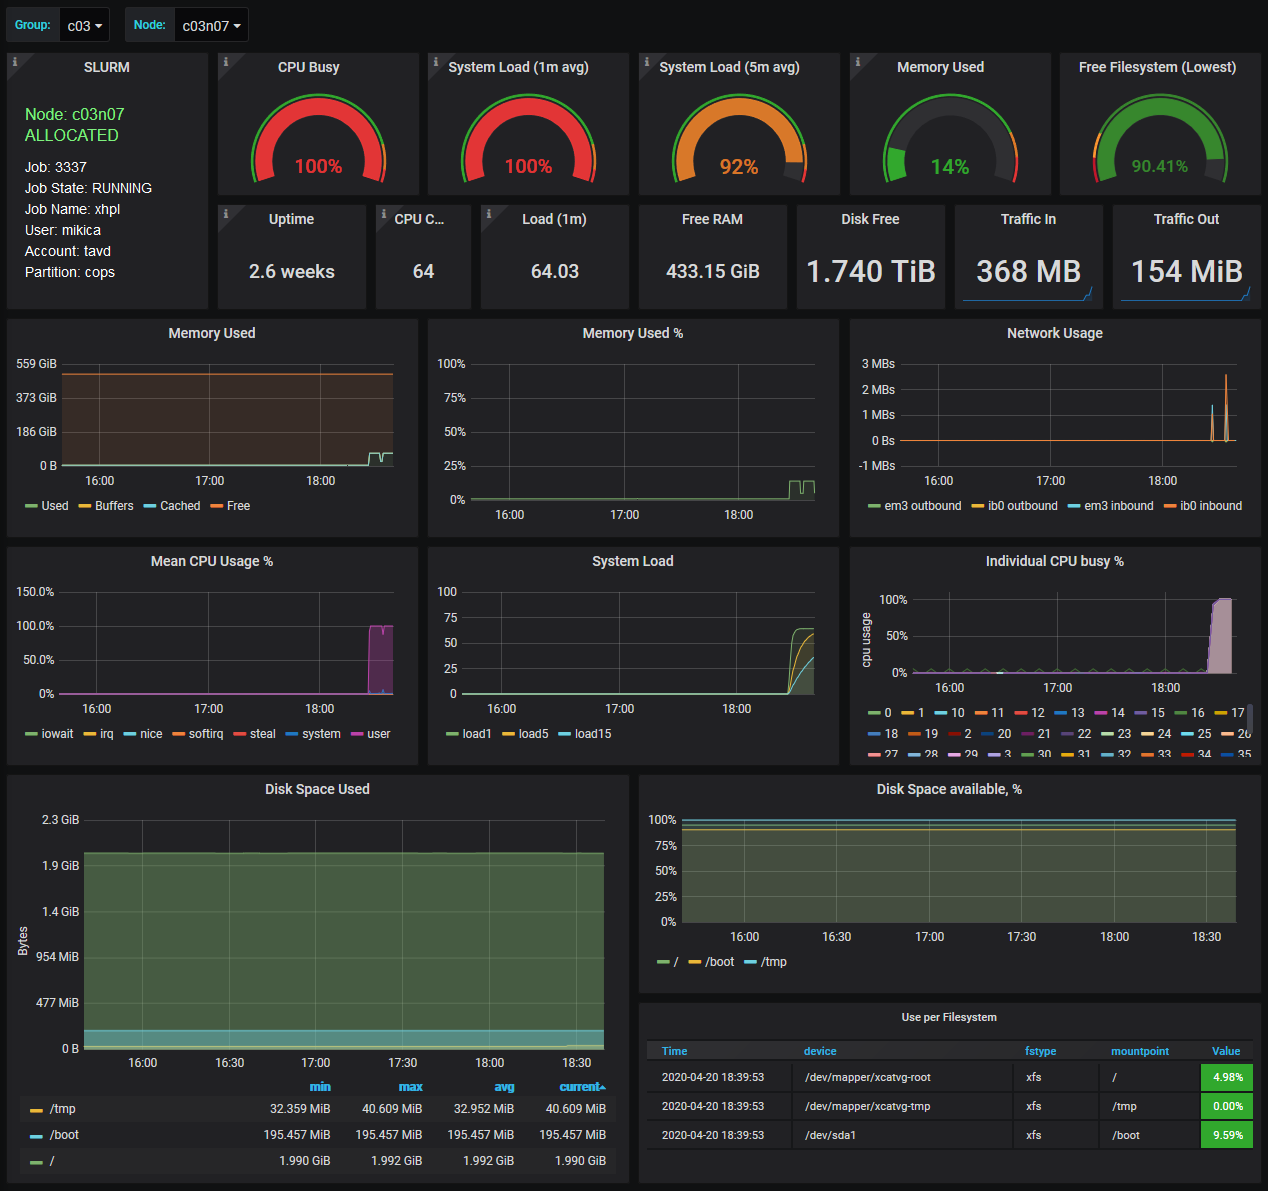
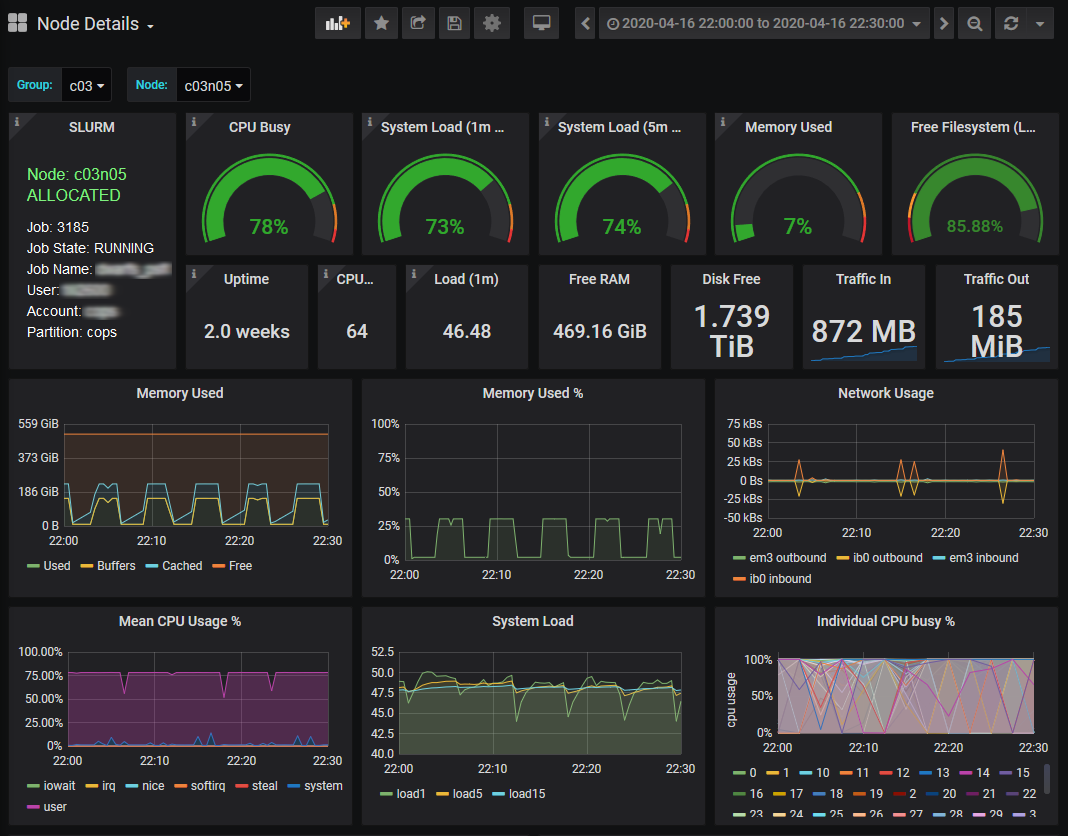
Compute nodes
The node performance details can be obtained selecting one of the nodes in the Nodes menu group (the compute nodes are grouped by hardware type).
Node details
The node details page shows to which job the node belongs, and the detailed cpu and memory usage of the node. Good jobs keep the nodes as busy as possible (with high cpu and memory usage) without choking them (the cpu usage should be 100% by a user and the memory should not enter the swap).
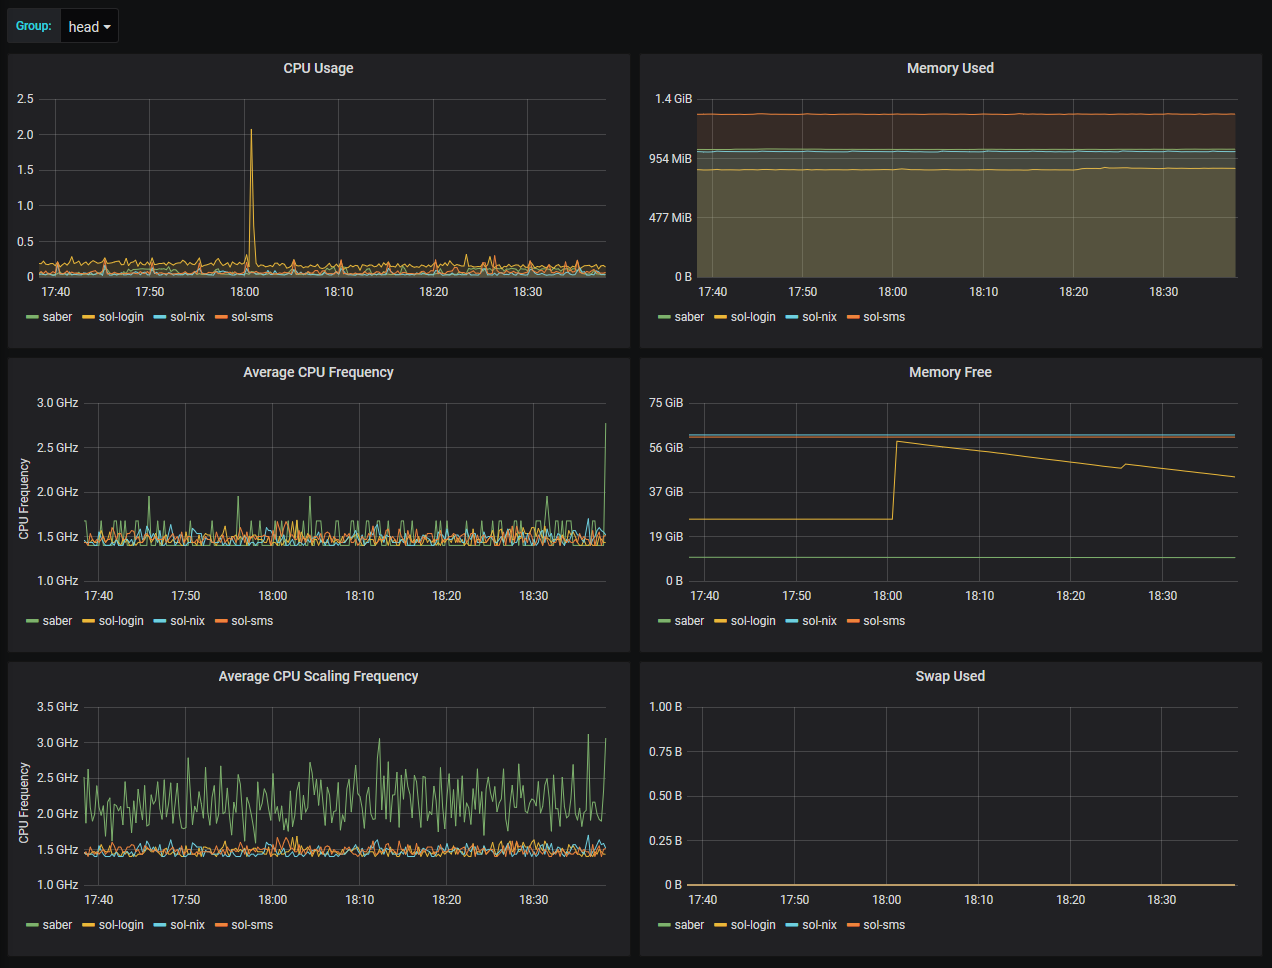
CPU and Memory statistics
The CPU and Memory stats page shows the the overall statistics in the specific group. Here one can also explore the head and file system nodes.
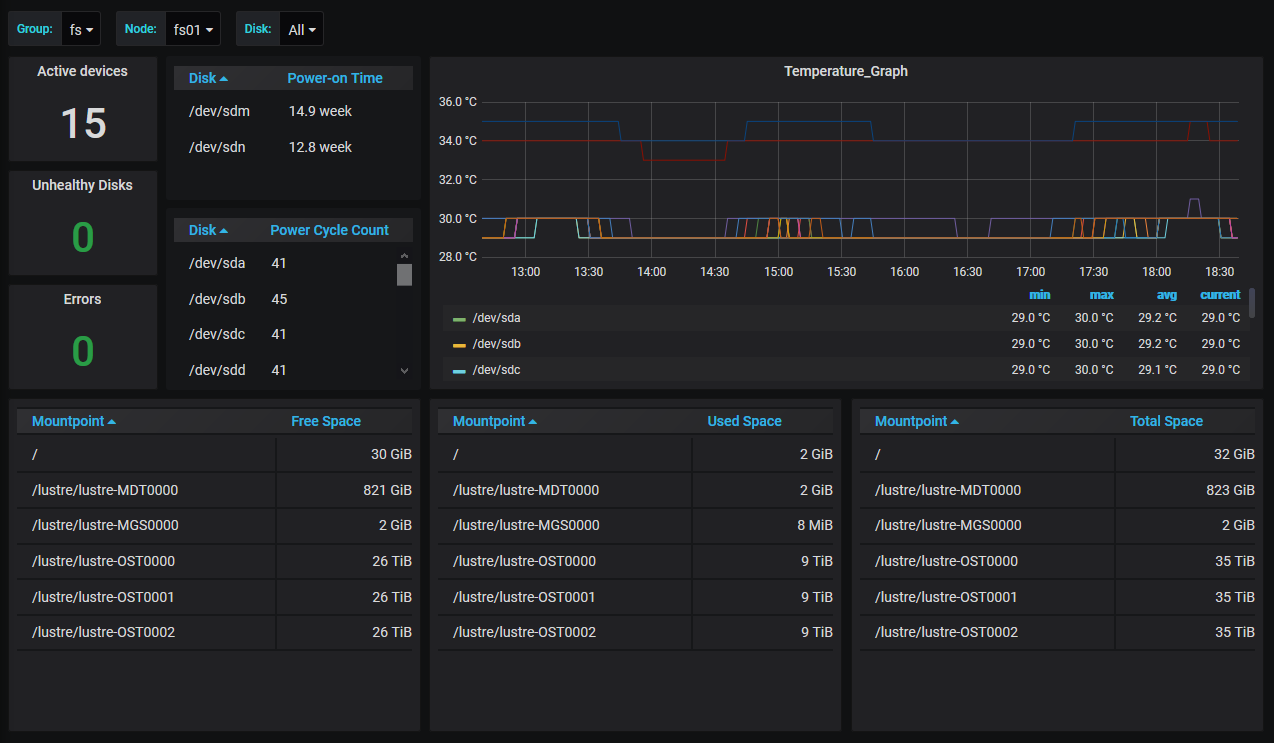
Disk status
The Disks status page shows the storage information for the selected node.
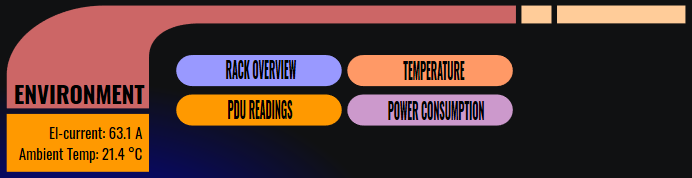
Environment
The Environment panels show the physical rack layout, the current temperature (ambient, CPU and disk), and the eletrical power consumption.
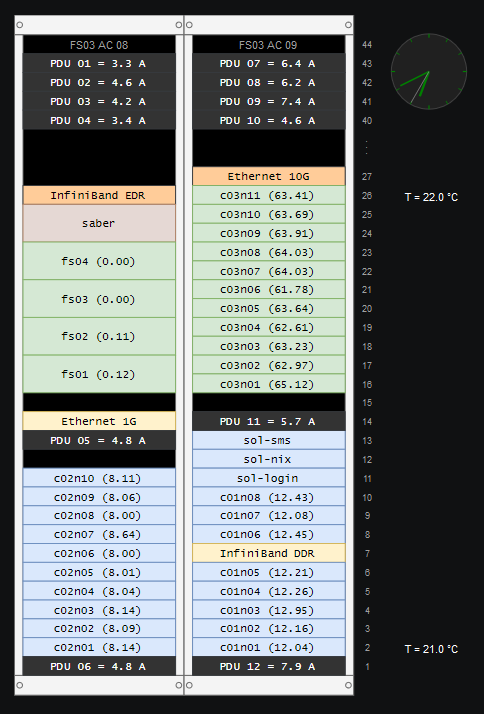
Rack overview
The rack overview shows the power distribution unit (PDU) readings, the average ambient temperature (at the top and bottom nodes in the rack), and the current node load (shown in parentheses).
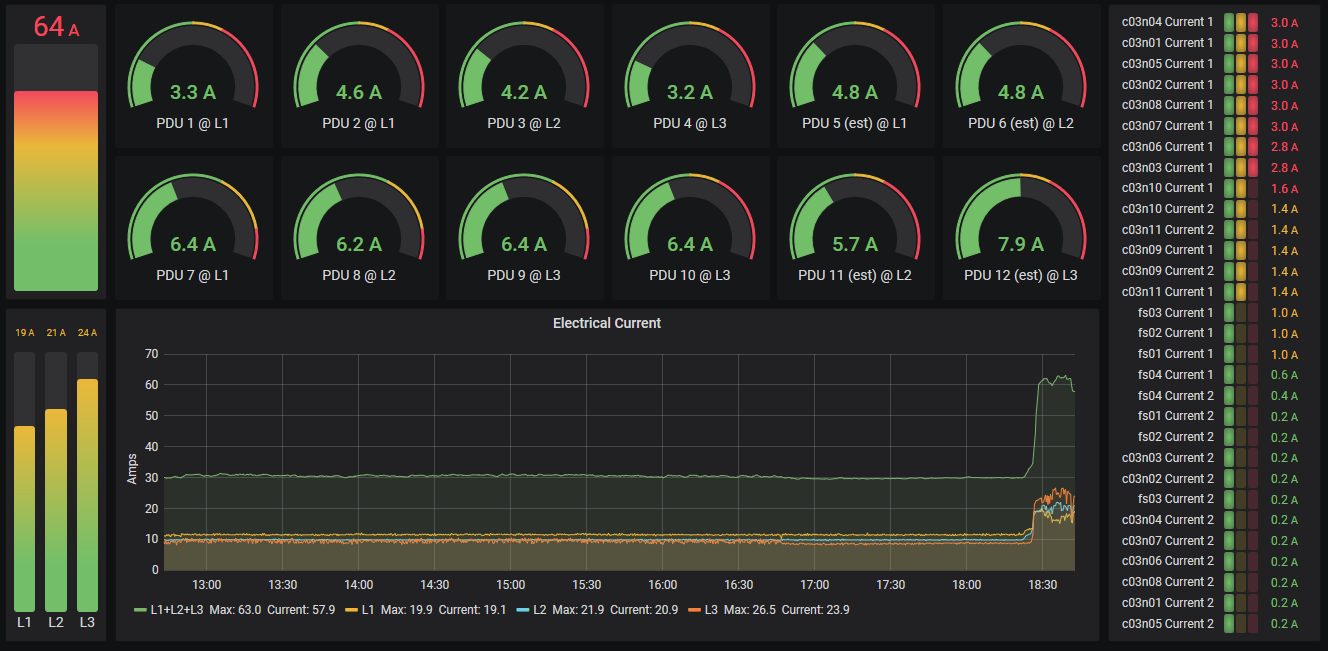
PDUs readings
The PDUs page shows the electrical current readings aggregated per PDU and phase.
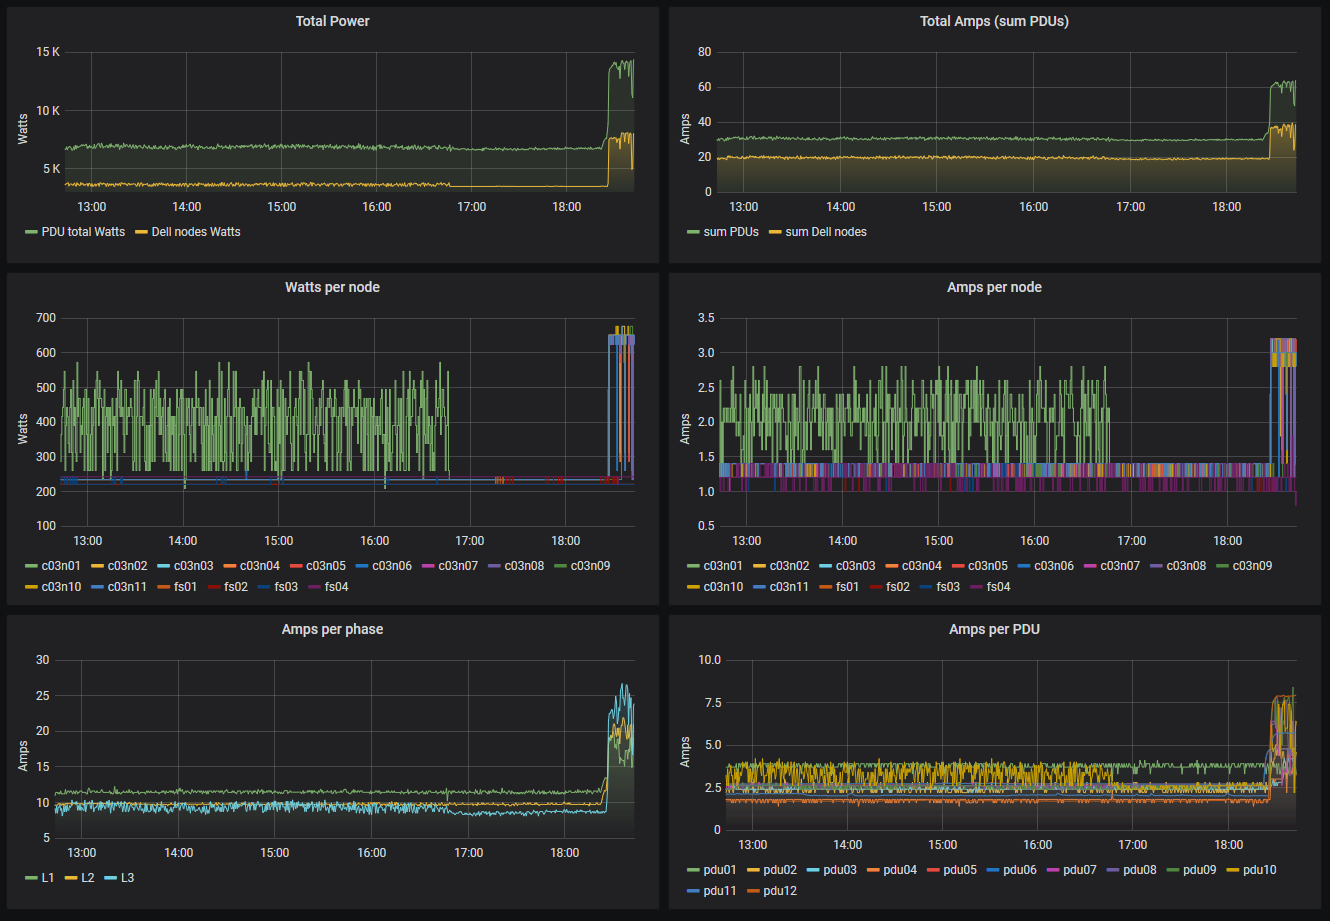
Power consumption
The power consumption page shows the detailed electrical power usage of the cluster over time.
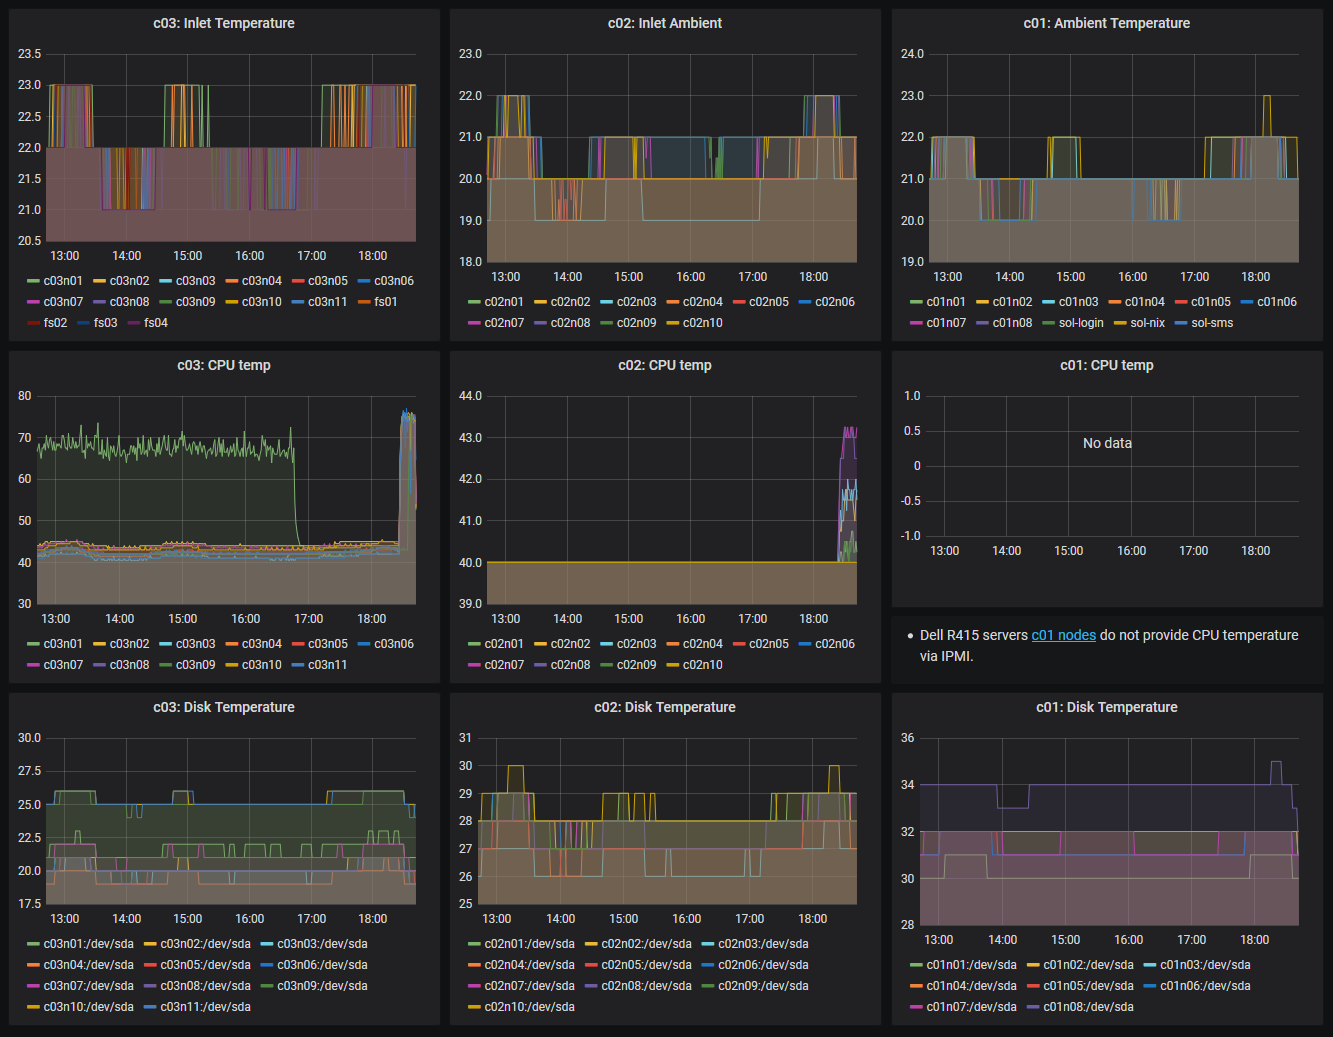
Temperature
The ambient, CPU and disk temperature readings are shown for different nodes grouped by hardware type.
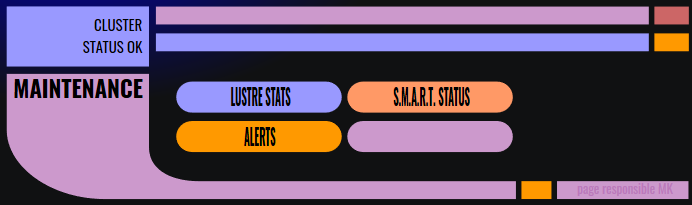
Maintenance
The maintenance panels are meant to be used by the system administrators. They show the Lustre file system statistics, S.M.A.R.T. disk status, and the overall cluster health (number of failed nodes and similar).
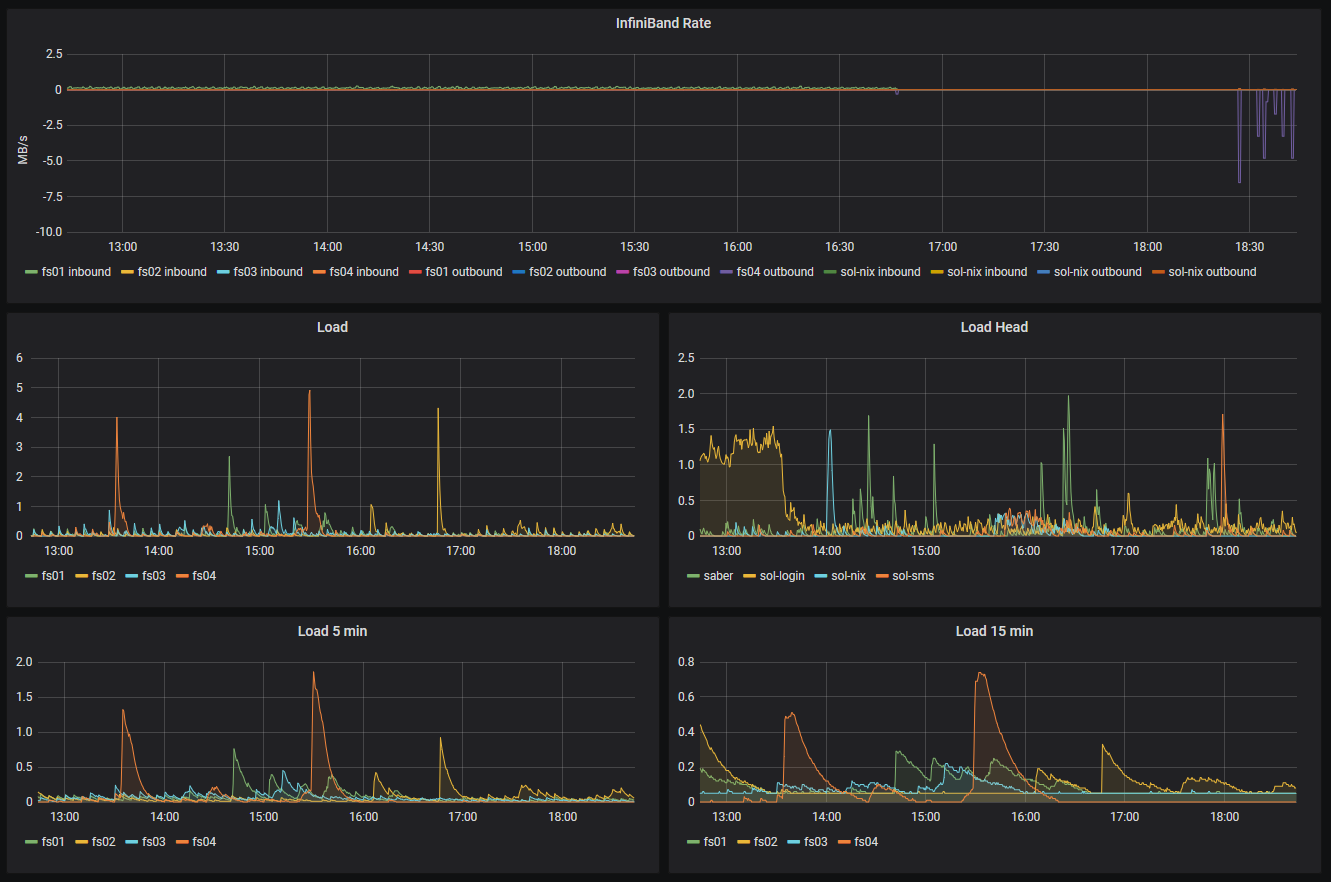
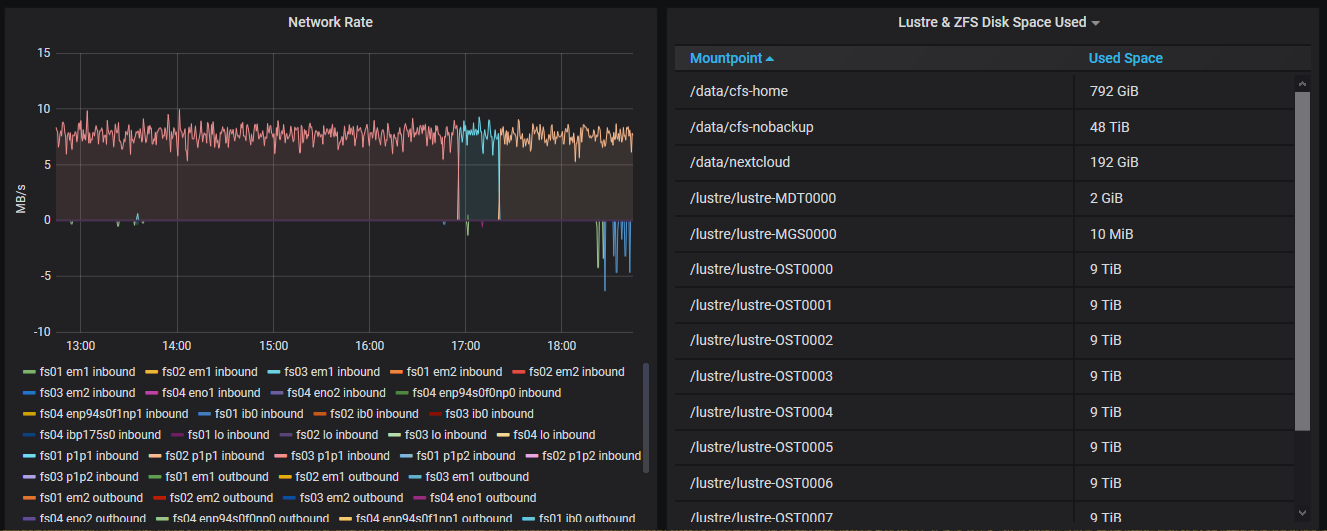
Lustre status
Accessing historical data
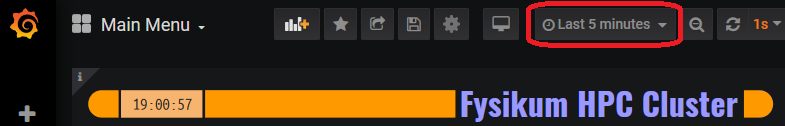
All the panels show the latest statitcs by default.
Also, the web pages are rendered in the so-called kiosk mode without the Grafana menus.
Pressing Esc exposses these additional menus. One particular
menu enables a user to select the time interval for the shown statistics
(encircled in red below):
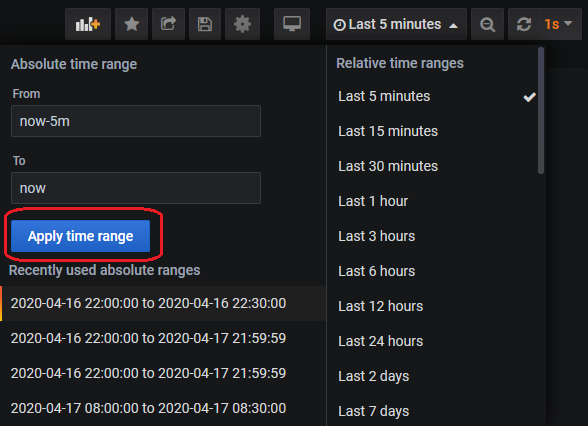
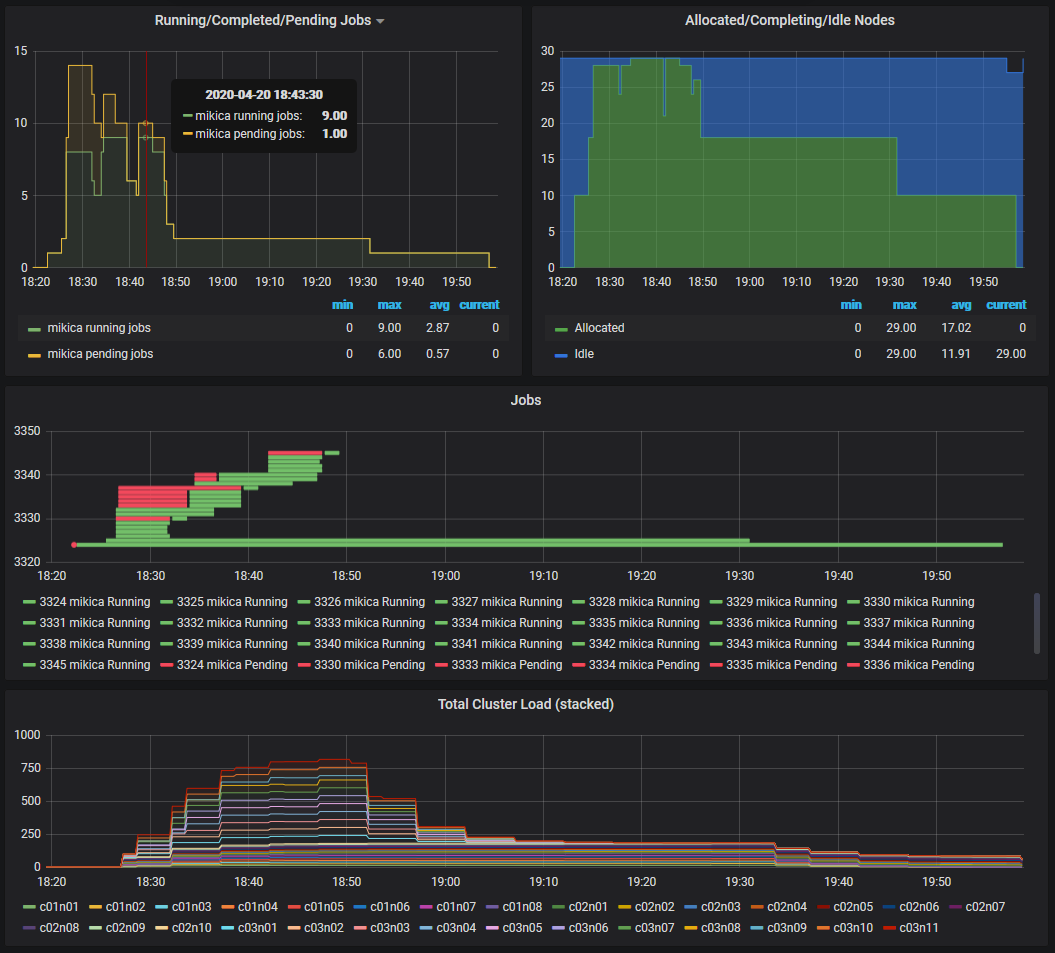
After selecting a time range, navigating to other links will show the metrics for the specific time (note the selected range on the following two figures). This is helpful in examining how the completed jobs had been perfoming historicaly.
An alternative way to select the time range of interest is to drag a region in any graph in any Slurm or Node panel, like in the running jobs panel below. After that, clicking on a job in the “current” jobs, will show the Slurm node and job status in the selected time range.